


The Dow Industrials and S&P 500 declined Friday, extending losses into a third week, their longest losing streak since January. Investors were primarily put off by weak first quarter earnings announcements within retail, particularly among brick and mortar-based apparel firms, falling to a three-month low. An improving retail sales report for April, up 1.3% from -0.3% in March, did little to limit Friday's losses. On a year-over-year basis however, retail sales are up 3%.
For the week, the S&P 500 fell -0.44%, extending its three-week decline to -2%; the Dow Industrials lost -1.16%; and MSCI EAFE (developed international) fell -0.28%.
What We’re Reading
Goldman Sachs Raises Oil Outlook -- Fox Business
Understanding Global Growth Views -- Bloomberg View
Moody's Cuts Saudi Credit Rating -- UPI
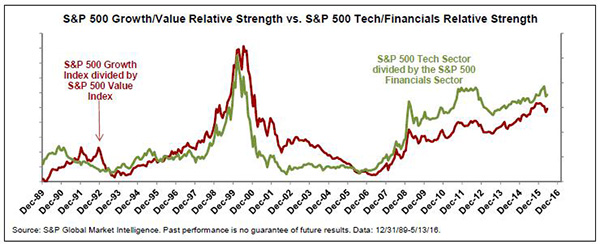
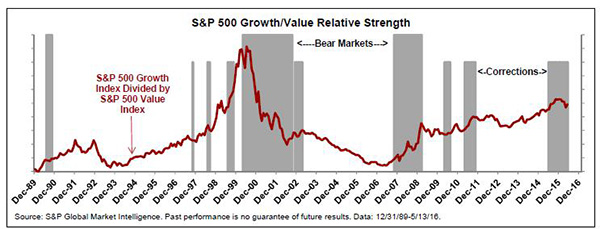
Chart of the Week: Growth Typically Outpaces Value; Yet Sector Composition Plays a Key Role
Historically speaking, the performance of the S&P 500 Growth Index outpaces the S&P 500 Value Index. According to S&P Global Market Intelligence, since 1989 the general tendency has been to say that value does best at the beginning of bull markets, while growth outperforms as the bull market matures. In the chart above, overlaying the relative strength chart of the S&P 500 Growth vs. Value Indices (growth divided by value) onto periods in which the S&P 500 suffered through corrections (declines of 10%-20%) and bear markets (declines >20%), we see that there has been a leaning toward value during the early period after the conclusion of bear markets, followed by a gravitation toward growth as the bull market matures and stumbles through corrections.
Interestingly, the relative strength line looks strikingly similar to the S&P 500 Technolgy Sector leading up to and subsequent to the bursting of the Tech Bubble of the late 1990s and early 2000s. What's more, the line also looks similar to that for the S&P 500 Financials sector before and after the financial crisis of late 2007-2009. Taking that thought further, could it be that the actions of the S&P 500 Growth vs. Value relative strength be largely explained by the relative performances of the S&P 500 Financials and Tech sectors? An S&P study of correlations suggests so.
The correlation of monthly percent changes in both the growth/value and tech/financials relative strength calculations generates a coefficient of 73%, a pretty convincing result.
Articles chosen and summarized by the Cetera Investment Management team. Cetera Investment Management provides investment management and advisory services to a number of programs sponsored by First Allied Securities and First Allied Advisory Services. Cetera Investment Management individuals who provide investment management services are not associated persons with any broker-dealer. International investing involves additional risk, including currency fluctuations, political or economic conditions affecting the foreign country, and differences in accounting standards and foreign regulations. These risks are magnified in emerging markets. Investing in companies involved in one specified sector may be more risky and volatile than an investment with greater diversification.