


U.S. equity markets concluded the holiday-shortened week sharply higher as investors embraced signs that the market may be stabilizing. Data from Bloomberg showed that thirty-day correlations between the S&P 500 and ten other asset classes (including oil), which have held sway on investors since January, have begun to fade since February 11, when the S&P 500 closed at a 22-month low. Improved economic data also helped drive many bearish investors to buy back a sizable amount of their short positions, as companies with the highest short interest were among the best performers. At the end of January, short interest had climbed to an average of 4.3% of all shares available to be borrowed—a level reached only one other time since 2008. After the Presidents' Day holiday on Monday, follow-on gains on Tuesday and Wednesday extended the prior Friday's rebound, pushing the S&P 500 to its first three-day rally this year. It sealed the week with its strongest performance since November.
For the week, the S&P 500 gained +2.91%, the Dow Jones Industrial Average added 418 points (+2.62%), while the EAFE (Developed International) surged +4.44%.
What We’re Reading
Oil Pares Gains on Record Inventory Glut -- Fox Business
Cameron Pencils June 23 for "Brexit" Referendum Vote -- NASDAQ.com
Corporate Bond Defaults on the Rise (Primarily within Oil & Gas Industry) -- Market Watch
Chart of the Week: Annualized Margin Debt Reaches a New High
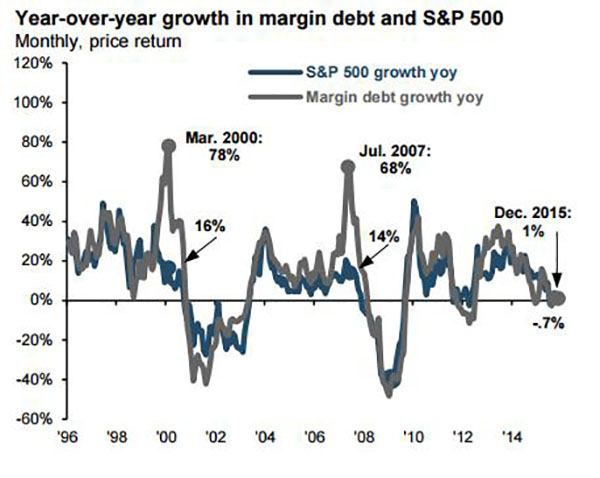
Source: NYSE, Standard & Poor's, J.P. Morgan Asset Management.
NYSE margin debt, or credit issued by brokerages as a way for investors to purchase additional shares in the equity market, has reached an all-time high.* This development is seemingly worrisome given the events of the Financial Crisis. However, when looking at the year-over-year growth rate of margin debt relative to the growth rate of the S&P 500, which is shown above in this week's chart, a separate story emerges. From the chart, it's apparent that there was a severe dislocation between the two in both March 2000 and July 2007, with margin debt growing almost five times faster than the equity market, indicating that investor exuberance was not linked to market fundamentals.
Today's market looks much different, with margin debt only growing 1% over 2015 and the equity market, excluding dividends, falling just 0.7% in 2015 (+1.38% including dividends). Therefore, while overall margin debt levels look elevated, the growth rate in relation to equity market movements indicates that investors are being much more prudent about margin debt and that we are not witnessing a market similar to 2000 and 2007.
*http://www.nyxdata.com/nysedata/asp/factbook/viewer_edition.asp?mode=tables&key=50&category=8
Articles chosen and summarized by the Cetera Investment Management team. Cetera Investment Management provides investment management and advisory services to a number of programs sponsored by First Allied Securities and First Allied Advisory Services. Cetera Investment Management individuals who provide investment management services are not associated persons with any broker-dealer. International investing involves additional risk, including currency fluctuations, political or economic conditions affecting the foreign country, and differences in accounting standards and foreign regulations. These risks are magnified in emerging markets. Investing in companies involved in one specified sector may be more risky and volatile than an investment with greater diversification.